2024 Year in Review
Higher exports, lower price drive up Ontario’s total demand in 2024
Total electricity demand in Ontario increased by about 1.7 per cent year over year at 139.4 terawatt-hours, up 2.3 TWh from the year before. Weather had a significant impact on demand, imports and exports for 2024, as Ontario experienced warmer temperatures and Quebec, the largest source of imported energy for this province, produced less power from its hydroelectric generators because of low run-off conditions brought on by wildfires and low precipitation in the summer and fall.
Because of the warmer temperatures in Ontario, 2024 saw more peak periods – there were 277 hours where the demand was greater than or equal to 20,500 MW – than in 2023, when demand was greater than or equal to 20,500 MW for 138 hours.
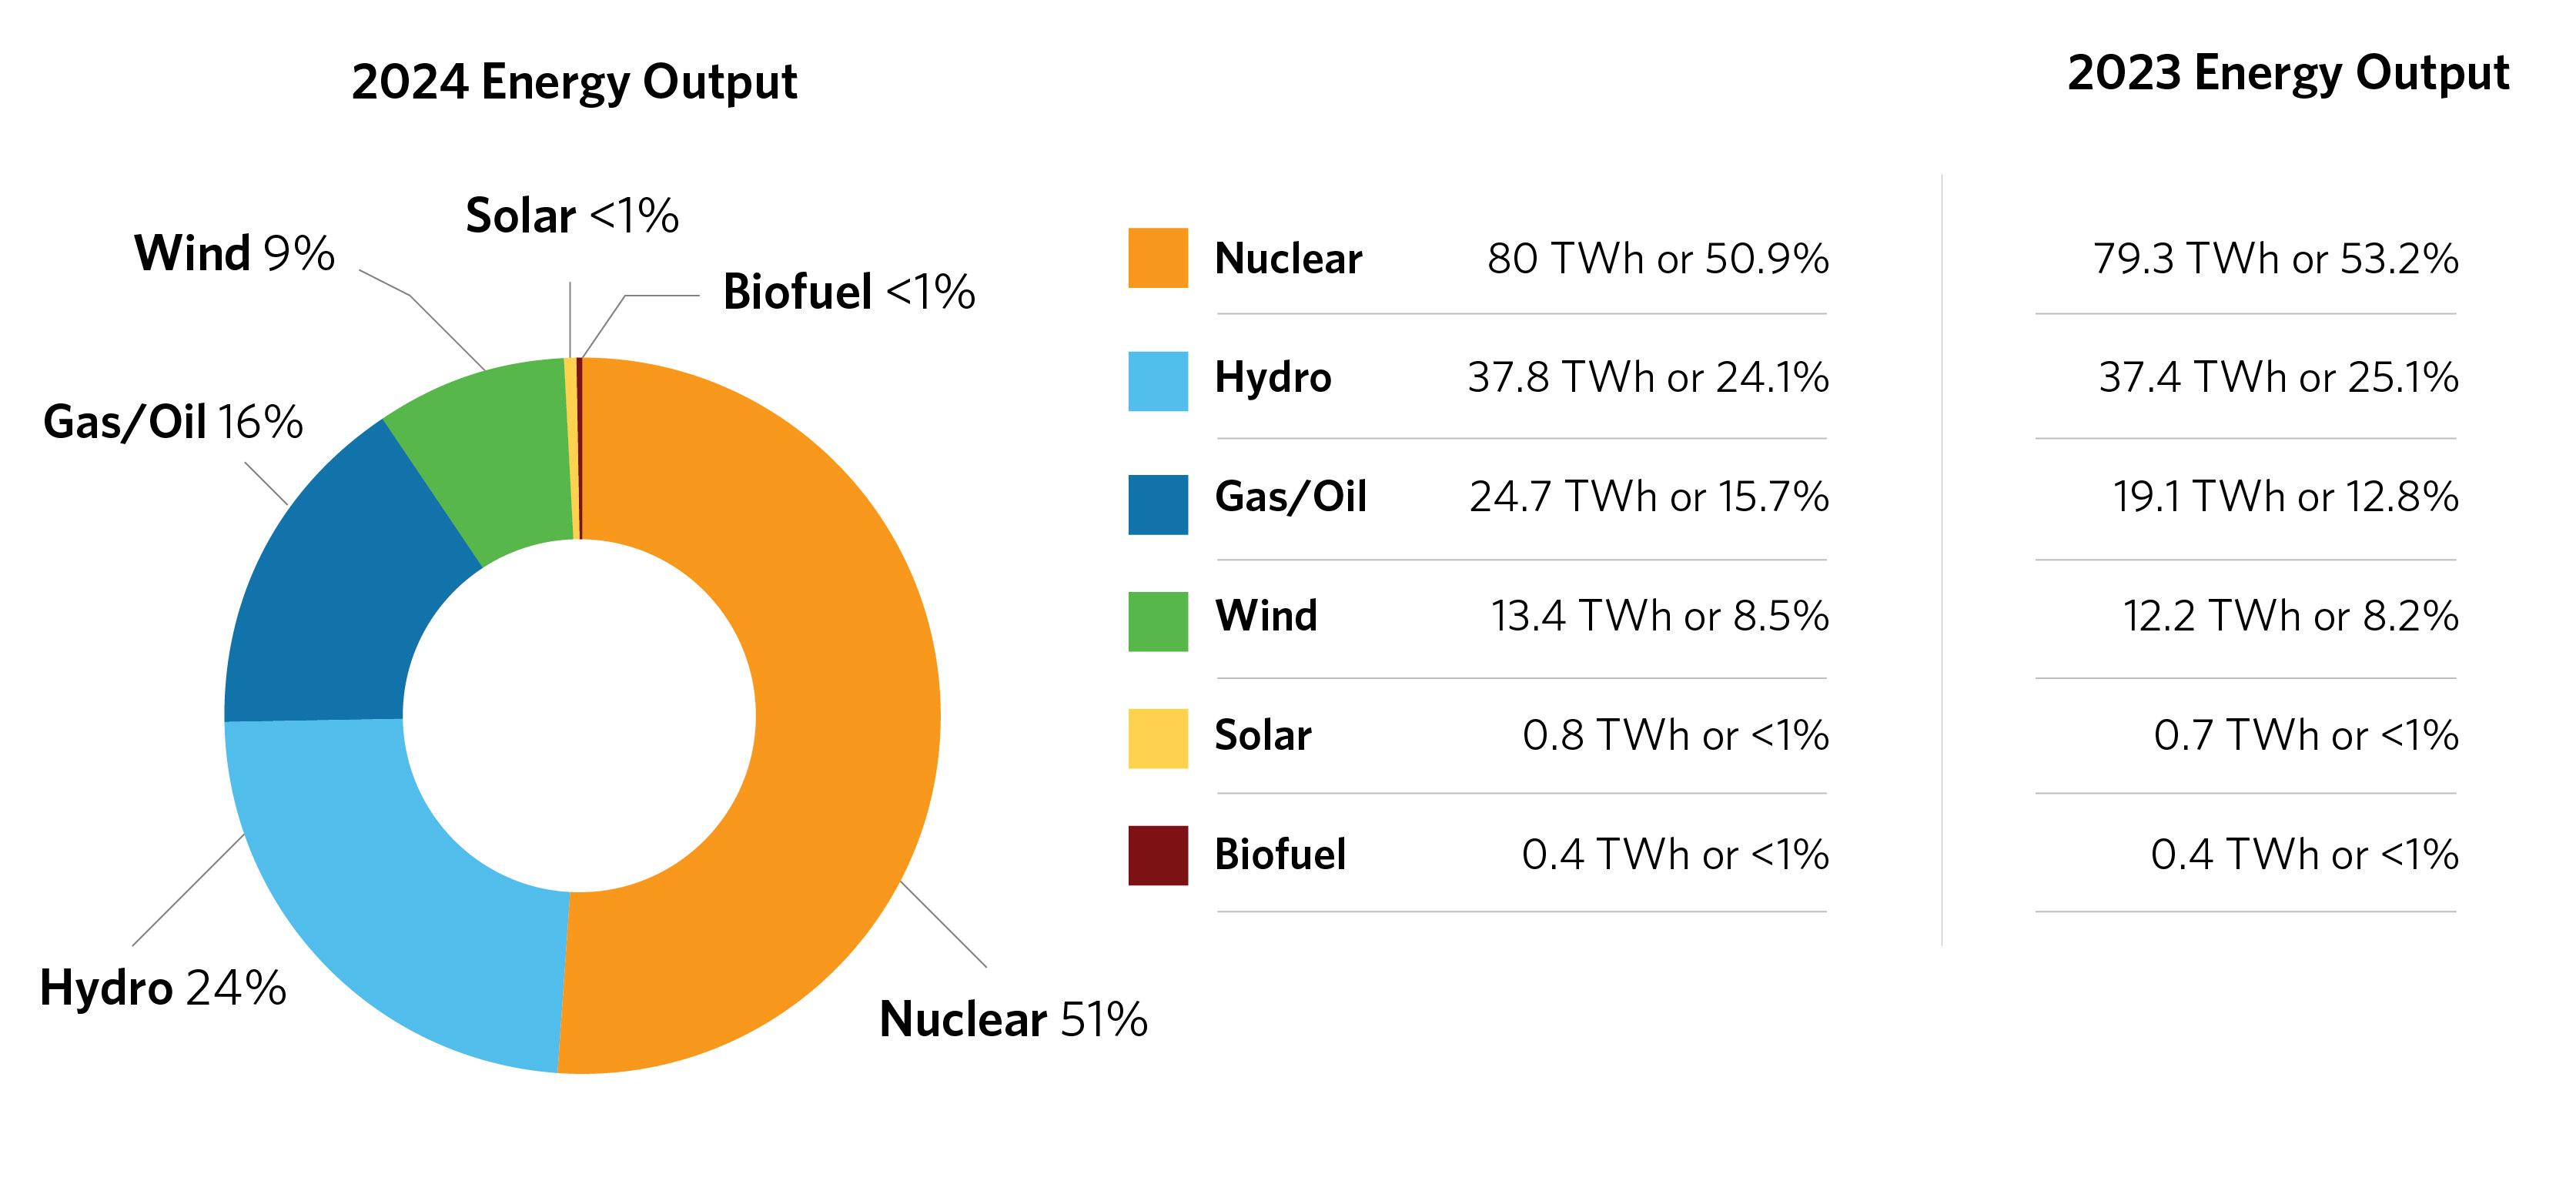
While there was an increase in Ontario’s exports to Quebec owing to weather-related impacts, this figure was also driven by Ontario’s competitive electricity price compared with neighbouring jurisdictions. The Hourly Ontario Energy Price, which was lower in 2024 than the year before, was the result of lower natural gas prices, which in turn led to an increase in output from gas-fired generation.
Nuclear refurbishments also continued, with up to three concurrent refurbishments taking place at any one time. Outages to nuclear generation from this work combined with reduced supply from imports also resulted in gas generation’s higher contribution to overall output in 2024.
Capacity
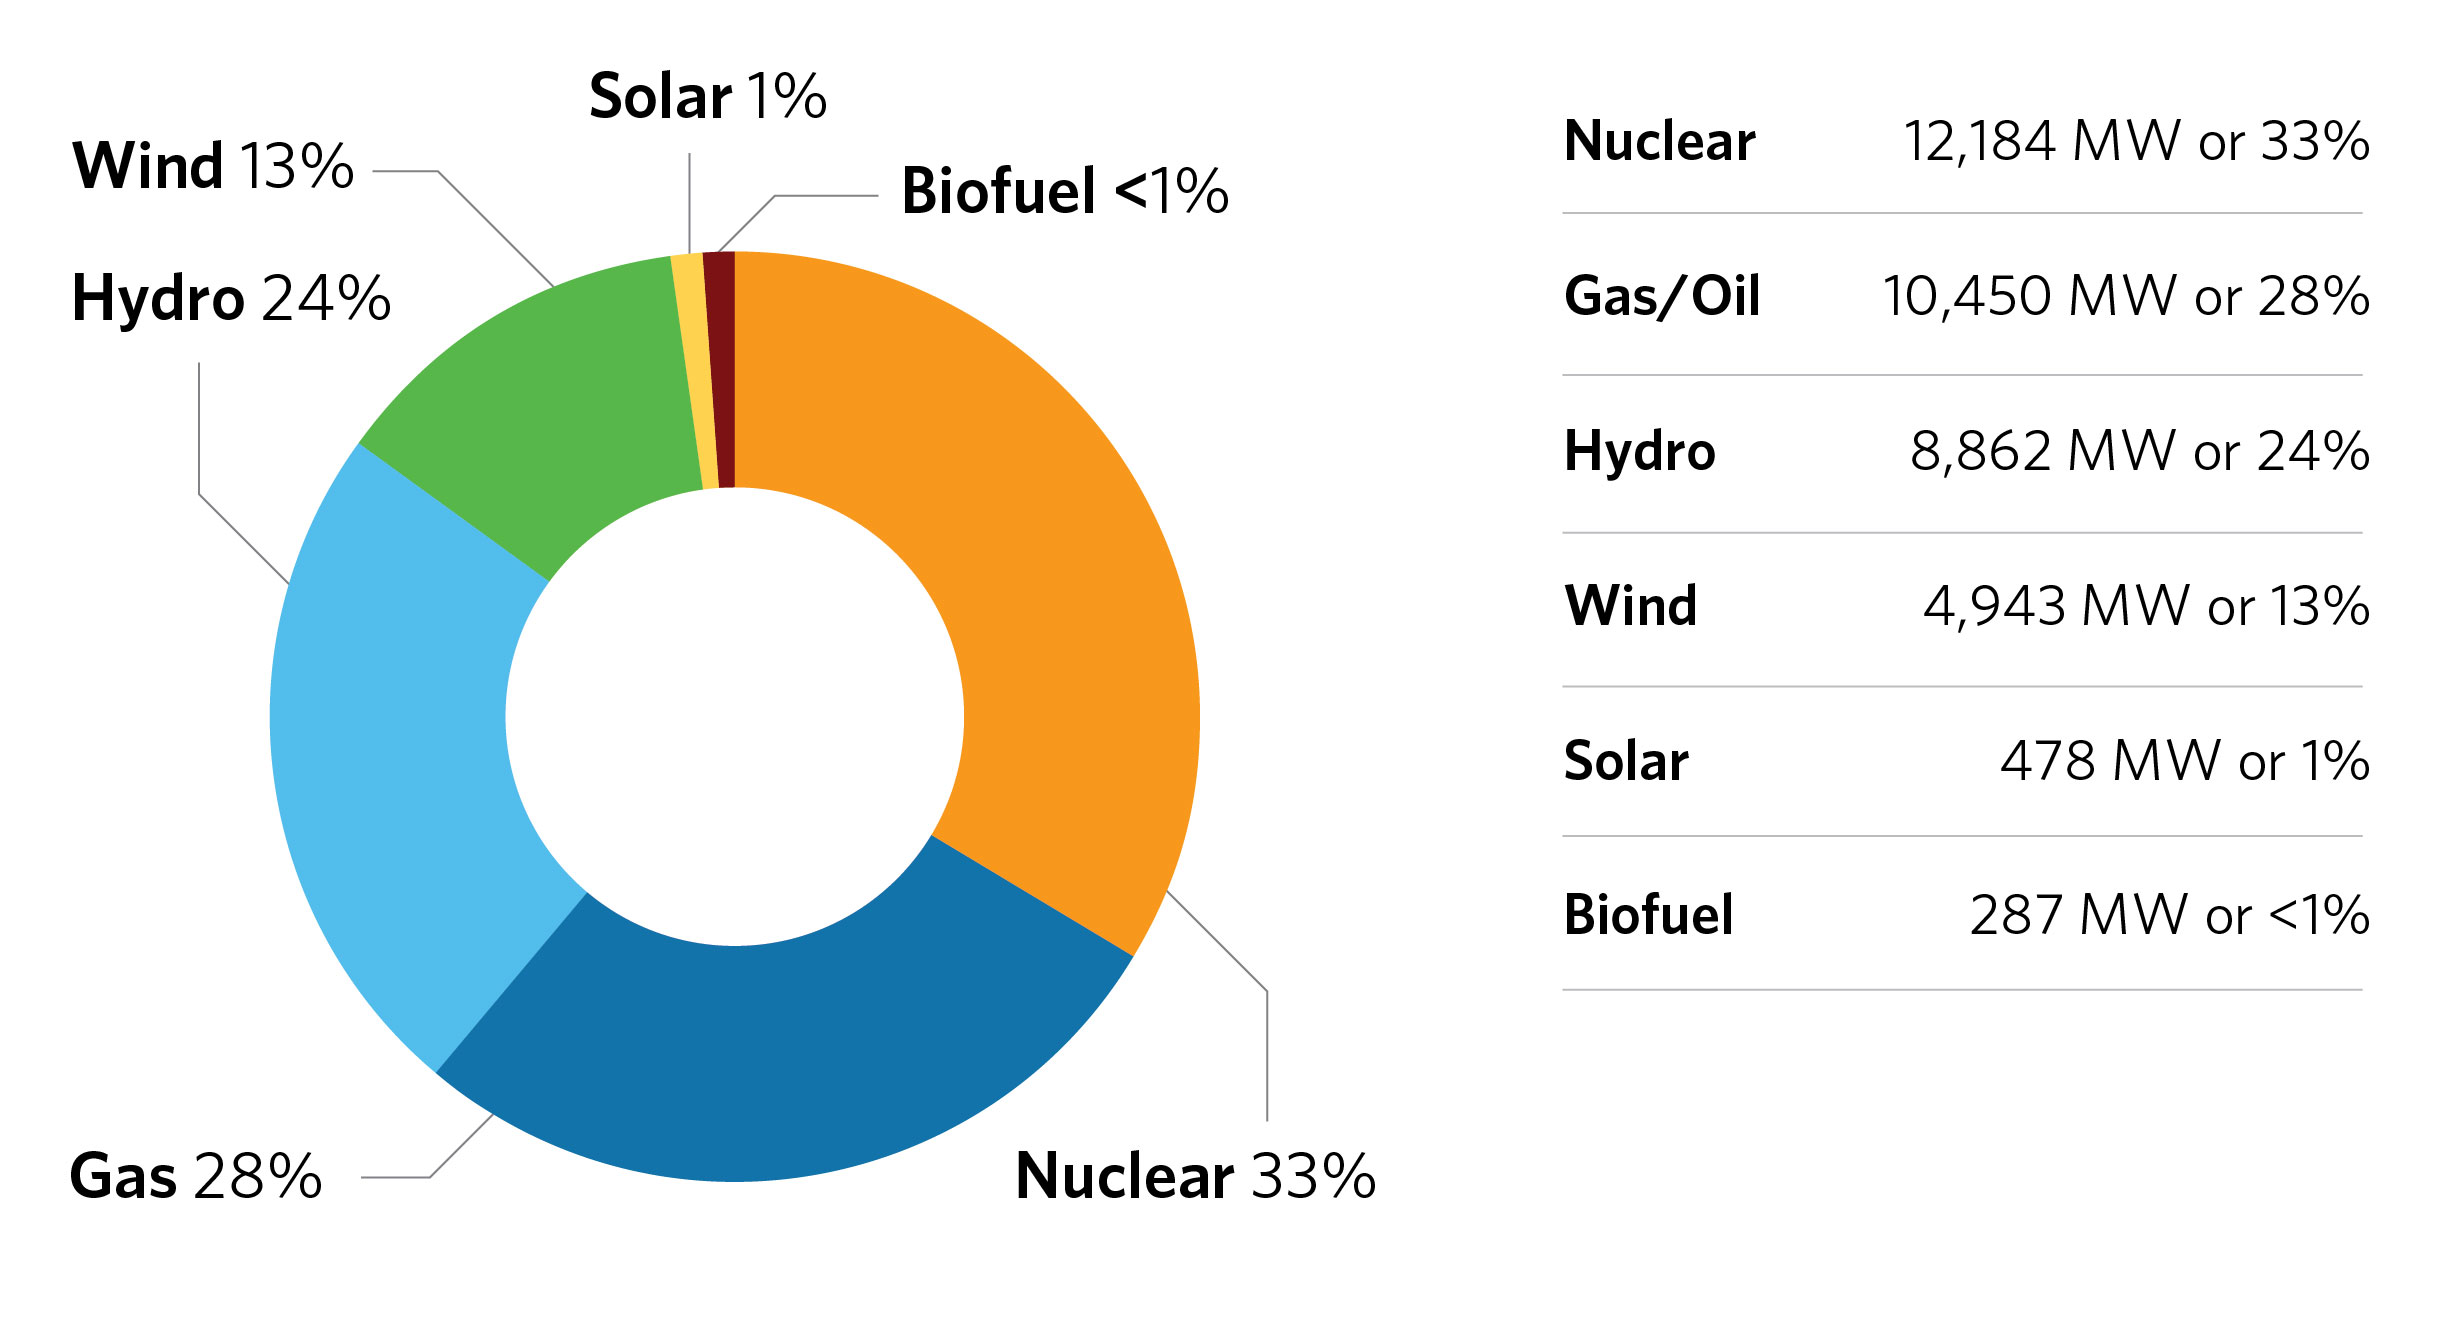
Grid-connected capacity in 2024 totalled 37,205 MW.

Capacity Auction
The IESO secured 2,122.2 MW of supply for summer 2025 and 1,523.6 MW for winter 2025-2026 through the 2024 Capacity Auction. This auction saw the highest level of competition ever and the resources secured were at a lower clearing price than the 2023 auction. As Ontario’s electricity demand continues to increase, and supply conditions tighten due to ongoing nuclear refurbishments and the recent retirement of Pickering Nuclear Generating Station, the Capacity Auction will continue to be critical to helping support reliability in Ontario’s electricity system.
Enhanced energy-efficiency programs
Over the course of the now-concluded 2021-2024 Conservation and Demand Management Framework, the IESO saw cumulative savings of 551 MW* and 3.3 TWh* in peak demand and electricity, respectively. This accounted for 76 per cent and 88 per cent of their respective targets.
Some more savings are still expected to roll in during 2025, but they would only account for an additional 48 MW and 194 GWh.
Of the 551 MW saved, the Peak Perks residential demand response program accounted for 185 MW of those savings through the 206,000 smart devices that were registered in the program as of the end of 2024.
* These savings have yet to be evaluated, measured and verified and are, thus, a preliminary figure.
Innovation
In 2024, several projects supported through the IESO’s Grid Innovation Fund were completed, providing valuable insights. They included:
- The Waterfront Neighbourhood Centre pilot demonstrated the case for deep energy building retrofits, including a lake-based hydrothermal heating and cooling system. The project resulted in more than 500,000 kWh of annual energy savings in the first year, reducing natural gas usage and operating costs by 99 per cent and 51 per cent, respectively.
- A project at a secondary school in London built a carbon-free microgrid. It successfully tested the behind-the-meter assets to reduce load requirements and provide grid support at the distribution and transmission levels.
- Two municipal wastewater treatment facilities in Ontario piloted a hydraulically driven aeration technology, Double Vortex Aerator (DVA), and demonstrated energy reductions for both sites. The project demonstrated the energy savings that can be made by integrating DVA.
Additionally, nine research/feasibility study projects were completed under the IESO’s Hydrogen Innovation Fund, which investigated if and how low-carbon hydrogen technologies can be integrated into Ontario’s electricity grid and explored the feasibility of site-specific hydrogen conversions at different locations across the province to balance and strengthen its reliable electricity system.
Demand, Supply and Price
Here is how Ontario’s electricity system performed in 2024:

2024 |
2023 |
||
Imports (TWh) |
1.6 |
4.1 |
|
Exports (TWh) |
19.1 |
16.5 |
|
Demand |
Total (TWh) |
139.4 23,852 MW on June 19 |
137.1 23,713 MW on Sept. 5 |
|
Price (cents/kWh) |
Hourly Ontario Energy Price (avg. weighted) |
3.37 |
2.99 |
|
Global Adjustment |
7.01 |
7.35 |
|
|
Total Cost of Power |
10.38 |
10.34 |
|
