2015 Year-End Data: Electricity Production, Consumption, Price and Dispatch Data
The annual release of 2015 electricity data by the IESO points to increased output from renewable sources of supply and continued uptake in electricity conservation programs.
Supply
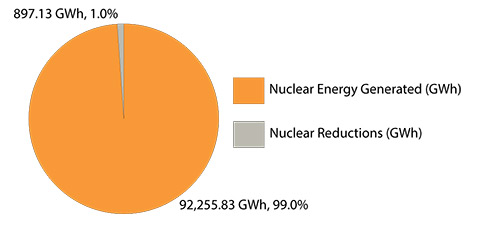
Production by Ontario's nuclear units remained high in 2015, comprising 60 percent of the transmission-connected power generated in Ontario. Consistent with the rapid growth in wind and solar resources, output from both types of supply increased significantly during the year.
The table below provides a summary of Ontario's generator output, broken down by fuel type, for the past three years.
Ontario Grid-Connected Electricity Production by Fuel Type 2013-2015
|
|
Nuclear |
Hydro |
Coal |
Gas/Oil |
Wind |
Biofuel |
Solar/Other |
|---|---|---|---|---|---|---|---|
|
2015 |
92.3 TWh |
36.3 TWh |
n/a |
15.4 TWh |
9.0 TWh |
0.45 TWh |
0.25 TWh |
|
2015 (% of total) |
60% |
24% |
n/a |
10% |
6% |
<1% |
<1% |
|
2014 |
94.9 TWh |
37.1 TWh |
0.1 TWh |
14.8 TWh |
6.8 TWh |
0.3 TWh |
0.0185 TWh |
|
2014 (% of total) |
62% |
24% |
<1% |
10% |
4% |
<1% |
<1% |
|
2013 |
91.1 TWh |
36.1 TWh |
3.2 TWh |
18.2 TWh |
5.2 TWh |
0.2 TWh |
n/a |
|
2013 (% of total) |
59% |
23% |
2% |
12% |
3% |
<1% |
n/a |
Due to rounding, percentages may not add to 100.
While the table above captures supply connected to the high-voltage transmission system, Ontario is also experiencing rapid growth of smaller scale distribution-connected, or embedded, generation. At the end of 2015, there were nearly 3,000 megawatts (MW) of IESO-contracted embedded generation helping to meet Ontario's electricity needs – an increase of approximately 20 percent from the 2,479 MW of embedded generation available at the end of 2014.
Demand
Electricity consumption in Ontario declined in 2015. Total energy withdrawn from the high-voltage transmission system in 2015 reached 137.0 terawatt-hours (TWh), down from 139.8 TWh in 2014 – a two-percent drop that can be attributed to conservation initiatives, increases in embedded generation, mild weather and broader economic shifts.
After 2014, when demand for electricity peaked at 22,774 MW on January 7 during a frigid winter, the province reverted to its normal status as a summer-peaking jurisdiction. Demand for electricity in 2015 reached 22,516 MW on July 28, though the summer was generally characterized by moderate temperatures. Contributing to this relatively low summer peak were increased output from solar units (at the distribution level, where it offsets demand for grid-connected supply) plus ongoing growth in demand management and energy-efficiency measures.
Price
The weighted wholesale price of electricity – the Hourly Ontario Energy Price (HOEP) – for 2015 came in at 2.36 cents/kilowatt-hour (kWh). The estimated 2015 Global Adjustment (GA) rate as at December 31, 2015 was 7.78 cents/kWh. The total cost of power for Class B consumers, representing the combined effect of the HOEP and the GA, was 10.14 cents/kWh.
Imports/Exports
Ontario is connected to a large network of transmission systems across North America, which supports system reliability and economic efficiency. Imports compete against domestic generation to provide electricity at the best possible price and to support the province's needs during periods of high demand. Ontario also exports electricity when economic and to help maintain system reliability.
Ontario continued to import energy in 2015, with Quebec providing the lion's share. On the export side, the lower Canadian dollar played an important part in the growth of exports to Michigan and New York.
The table below provides a summary of Ontario's electricity imports and exports for 2014 and 2015.
Imports and Exports for 2014 and 2015
|
2015 Total Imports |
5,763.5 GWh |
|
2015 Total Exports |
22,618.0 GWh |
|
2014 Total Imports |
4,923.2 GWh |
|
2014 Total Exports |
19,073.3 GWh |
|
Change from Previous Year (Imports) |
+17.1% |
|
Change from Previous Year (Exports) |
+18.6% |
Annual Imports and Exports for Jurisdiction
| Manitoba | Michigan | Minnesota | New York | Quebec | Total | |
| Total Imports | 477 GWh | 198 GWh | 42 GWh | 280 GWh | 4,767 GWh | 5,764 GWh |
| Total Exports | 789 GWh | 10,248 GWh | 157 GWh | 8,571 GWh | 2,852 GWh | 22,618 GWh |
Conservation
Conservation is a cost-effective and reliable resource that leverages investments that have already been made in existing assets and reduces the need for new electrical infrastructure. Preliminary results for the first nine months of 2015 indicate 489 gigawatt-hours (GWh) of net energy savings attributable to programs delivered by local distribution companies and the IESO.
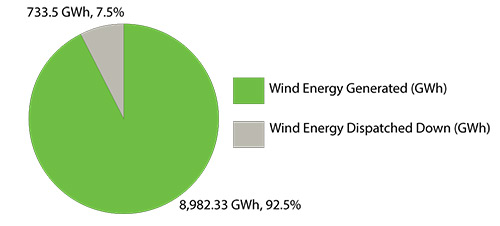
Wind Dispatch Overview
With the implementation of the dispatch of renewable generation in fall 2013, wind generation facilities in Ontario help support ramping and balancing on the system. In particular, the wind dispatch helps avoid nuclear shutdowns during periods of surplus baseload generation (SBG).
In 2015, the total amount of wind energy that was dispatched down was 733.5 GWh, representing 7.5 per cent of the total amount of wind energy produced in the province.
The wind dispatch is just one tool used by the IESO to provide operational flexibility. The integration of hourly centralized forecast into the IESO scheduling tools as well as enhanced visibility of renewable output have also been instrumental in managing a system with increasing levels of renewable generation with greater efficiency.
Wind Dispatch - Actual Energy (GWh)
*Note that these values include grid-connected wind generation only.