The IESO has posted electricity data for 2014, which highlights major trends for Ontario's power system over the past year. Total Ontario grid-connected generator output by fuel type over the year was: Nuclear 62%; Hydro 24%; Gas/Oil 10%; Wind 4%; all remaining fuel types were less than one per cent.
A mild summer in 2014 contributed to reduced overall consumption, which was 139.8 TWh in 2014, slightly lower than 2013 Ontario demand. The province also experienced the first annual winter peak in a decade, with peak demand of 22,774 MW recorded on January 7, 2014 – still low however, compared to the last annual winter peak set in 2004 which was more than 2,200 MW higher.
Supply
Over 2014, more than 1,900 MW of new supply came into commercial operation on the province’s transmission and distribution systems - in the form of wind, solar, biofuel and hydro generation.
Three major trends emerged in Ontario’s power supply in 2014:
- The phase out of coal was completed. This resource has been replaced with nuclear power providing baseload supply, gas generation which can provide baseload and peak supply as needed, and wind generation.
- Hourly wind output surpassed the 2,600 MW mark on December 31, 2014, while wind output over the year reached 4.4 per cent of total generation production.
- By the end of the year, more than 1,925 MW of wind and solar generation was operating within distribution systems.
Ontario Grid-Connected Electricity Production by Fuel Type 2013-2014
|
|
Nuclear |
Hydro |
Coal |
Gas/Oil |
Wind |
Biofuel |
Solar/Other |
|---|---|---|---|---|---|---|---|
|
2014 |
94.9 TWh |
37.1 TWh |
0.1 TWh |
14.8 TWh |
6.8 TWh |
0.3 TWh |
0.0185 TWh |
|
2014 (% of total) |
62% |
24% |
<1% |
10% |
4% |
<1% |
<1% |
|
2013 |
91.1 TWh |
36.1 TWh |
3.2 TWh |
18.2 TWh |
5.2 TWh |
0.2 TWh |
n/a |
2013 (% of total) |
59% |
23% |
2% |
12% |
3% |
<1% |
n/a |
Due to rounding, percentages may not add to 100.
Note: Fuel supply categories have changed. The new category GAS/OIL includes dual-fuel facilities. The new SOLAR category includes grid-connected facilities, which for 2014 was generation in the process of commissioning. Almost all solar generation in Ontario is currently connected to distribution systems.
Ontario exported 19.1 TWh of electricity over the year, and imported 4.9 TWh, mostly from Quebec.
Annual Imports and Exports by Jurisdiction
| Manitoba | Michigan | Minnesota | New York | Quebec | Total | |
| Total Imports | 413.6 GWh | 343.8 GWh | 40.2 GWh | 481.0 GWh | 3,644.6 GWh | 4,923.2 GWh |
| Total Exports | 296.1 GWh | 7,436.6 GWh | 198.0 GWh | 7,623.3 GWh | 3,519.3 GWh | 19,073.3 GWh |
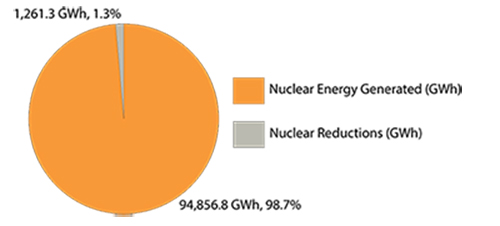
In 2014, wind reductions represented 4.6 per cent of total available wind production, but helped to avoid 18 nuclear shutdowns. In all, there was only one nuclear shutdown due to surplus baseload conditions during the year, down from six the year before.
Demand
Total energy consumption of 139.8 TWh in 2014 was slightly lower than 2013 demand levels.
Winter peak:
The province experienced the first annual winter peak in a decade, with demand reaching 22,774 MW on January 7, 2014, while generation availability in January was strong – at times reaching as high as 28,000 MW.
Summer peak:
The summer peak was 21,363 MW, roughly 20 per cent lower than the all-time high set in 2006, partly due to conservation and energy-efficiency measures and to embedded solar generation capacity that reached 1,500 MW.
Price
The average weighted cost of the electricity commodity in 2014 was 9.06 cents/kWh*, an increase of 5.7 per cent year over year. This commodity cost includes both the wholesale price and the final 2014 Global Adjustment.
The average weighted wholesale price, or Hourly Ontario Energy Price, was 3.60 cents/kWh, almost a cent higher than the previous year.
These higher HOEP costs resulted in a lower Global Adjustment, which was 5.46 cents/kWh**, down from 5.92 cents/kWh in 2013.
*Includes the HOEP and final 2014 GA.
** For more details, see http://www.ieso.ca/imoweb/pubs/marketReports/monthly/2014Dec.pdf
Wind Dispatch Overview
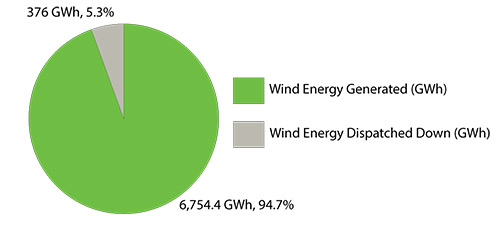
With the implementation of the dispatch of renewable generation in fall 2013, wind generation facilities in Ontario help support ramping and balancing on the system. In particular, the wind dispatch helps avoid nuclear shutdowns during periods of surplus baseload generation (SBG).In 2014, the total amount of wind energy that was dispatched down was 376 GWh, representing 5.3 per cent of the total amount of wind energy produced in the province.
The wind dispatch is just one tool used by the IESO to provide operational flexibility. The integration of hourly centralized forecast into the IESO scheduling tools as well as enhanced visibility of renewable output have also been instrumental in managing a system with increasing levels of renewable generation with greater efficiency. For more information on the IESO’s Renewable Integration initiative, please see www.ieso.ca/Pages/Participate/Stakeholder-Engagement/SE-91.aspx.
Wind Dispatch – Actual Energy (GWh)
* Note that these values include grid-connected wind generation only.


