Electricity consumption across Ontario
Consumers' response to the new electricity price plans offered in Ontario
There has been a steady progression of electricity customers making the switch to new price plans since the introduction of the Customer Choice Program in 2021. The program enables consumers to choose between the standard Time-of-Use (TOU), Tiered and new Ultra-Low Overnight (ULO) TOU price plans.
The Smart Metering Entity (SME) has been measuring consumers' response to the new electricity price plans and is providing data and analysis to the Ontario Energy Board (OEB) who evaluate the price plans currently on offer. This process supports the continuing development and design of price plans for the future.
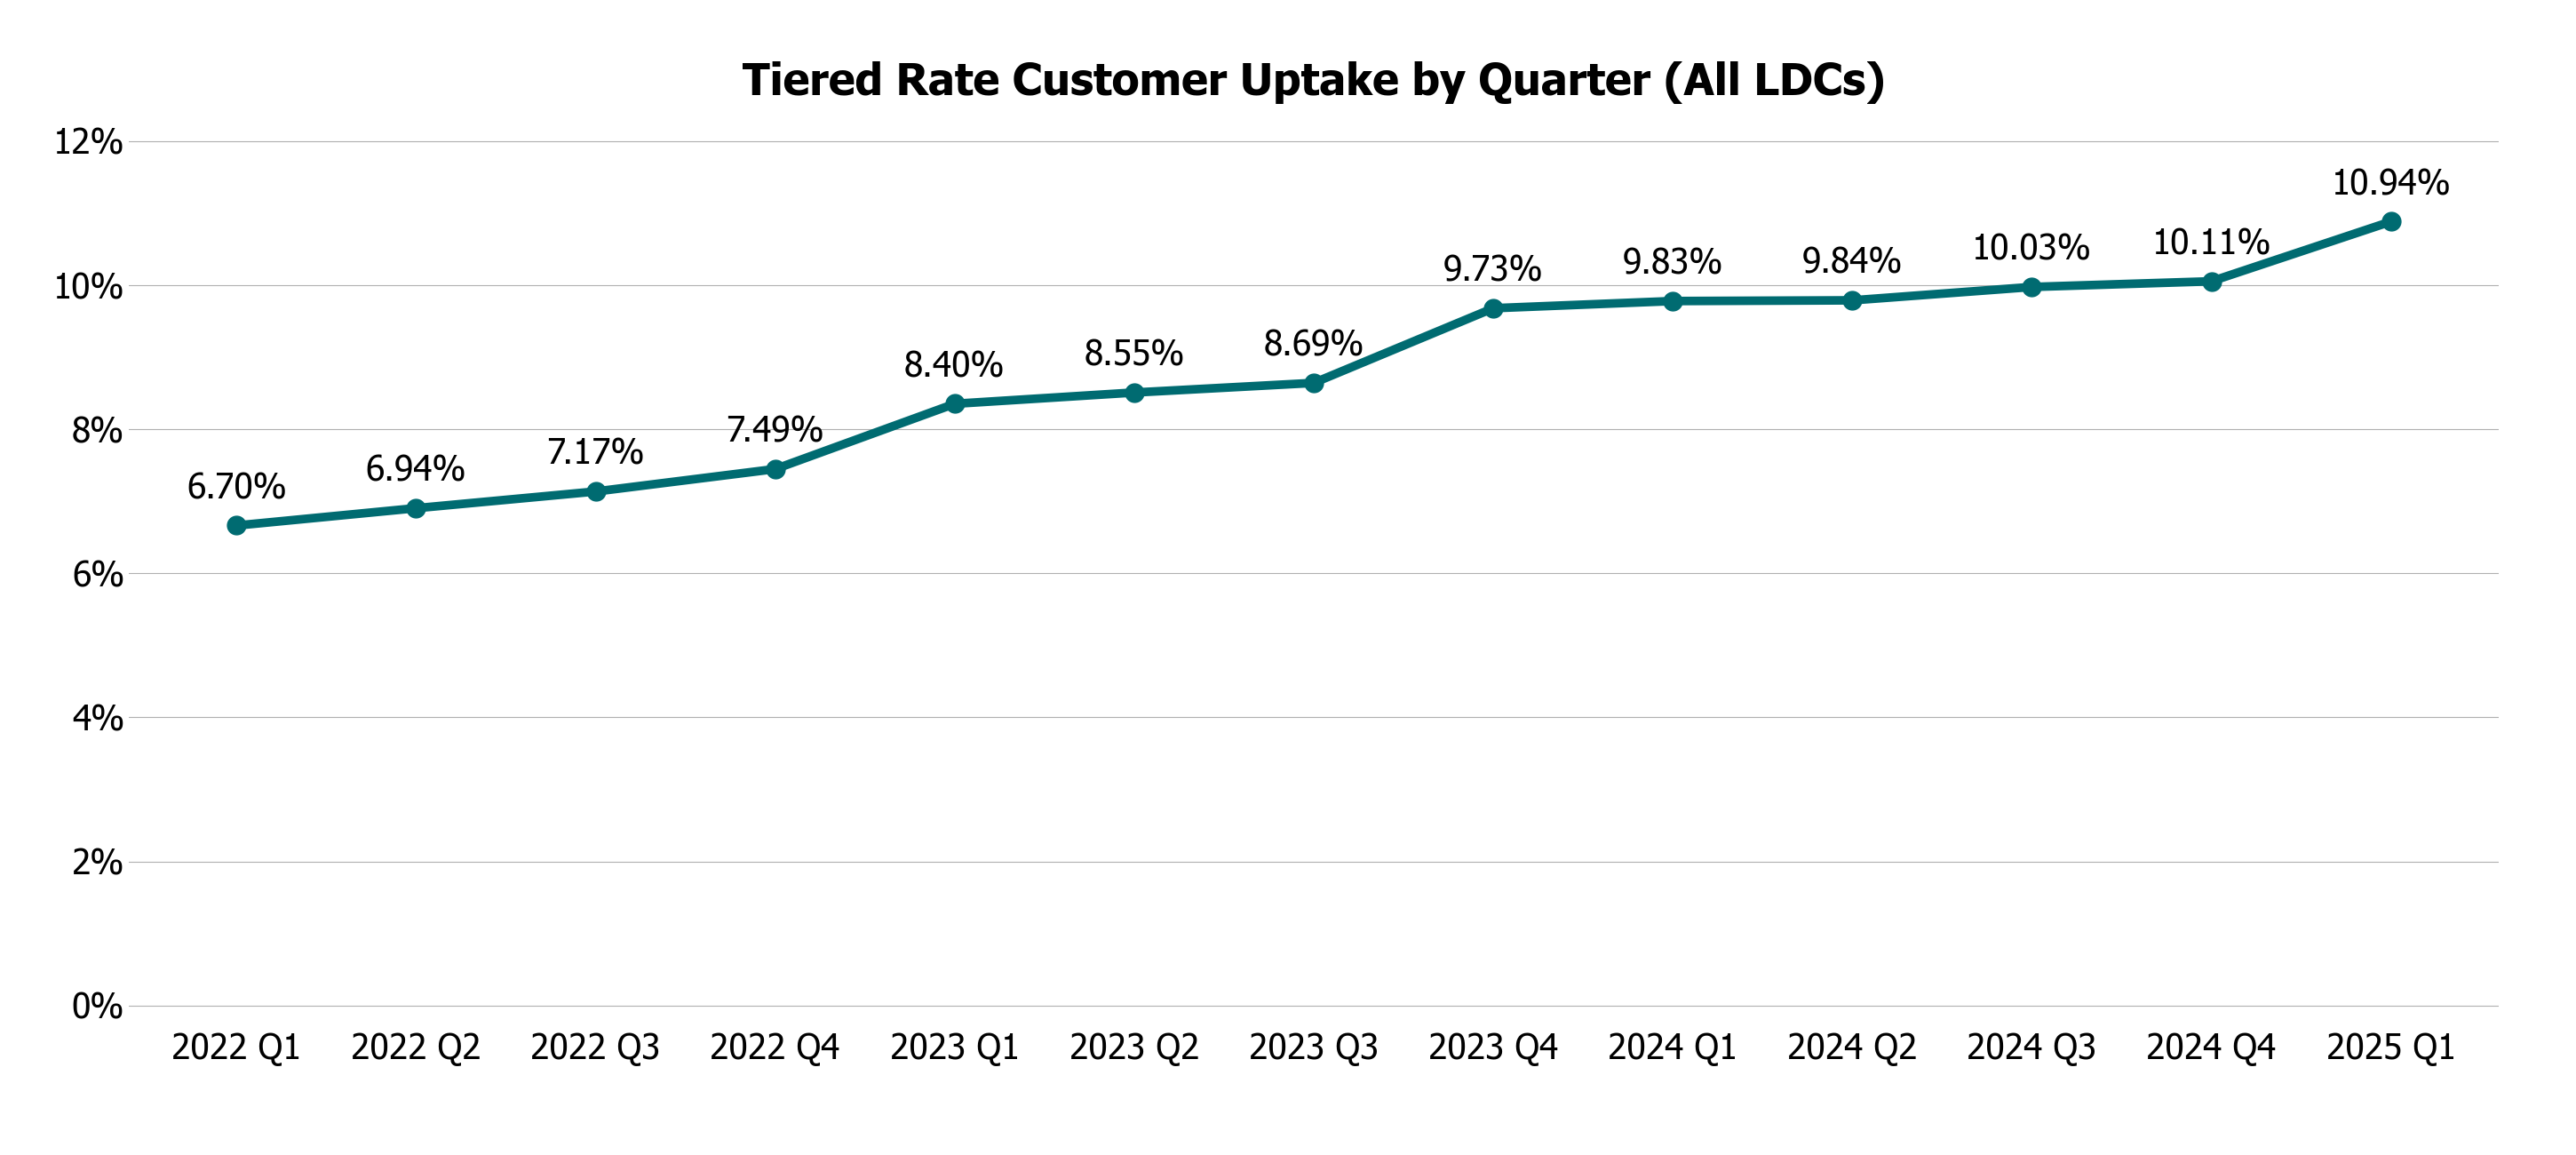
Shown below is the overall proportional uptake for the new price plans in Ontario since the start of the Customer Choice Program.


Using smart meter data to follow consumption trends across Ontario
The IESO uses SME aggregated smart meter data as an input for its own forecast models used to manage the power grid. Leveraging aggregated smart meter data has helped improve the accuracy of demand forecasting and understanding new residential behaviours. As the IESO looks to the future, new work from home patterns are something our forecasters will take into account for daily operation of the grid.
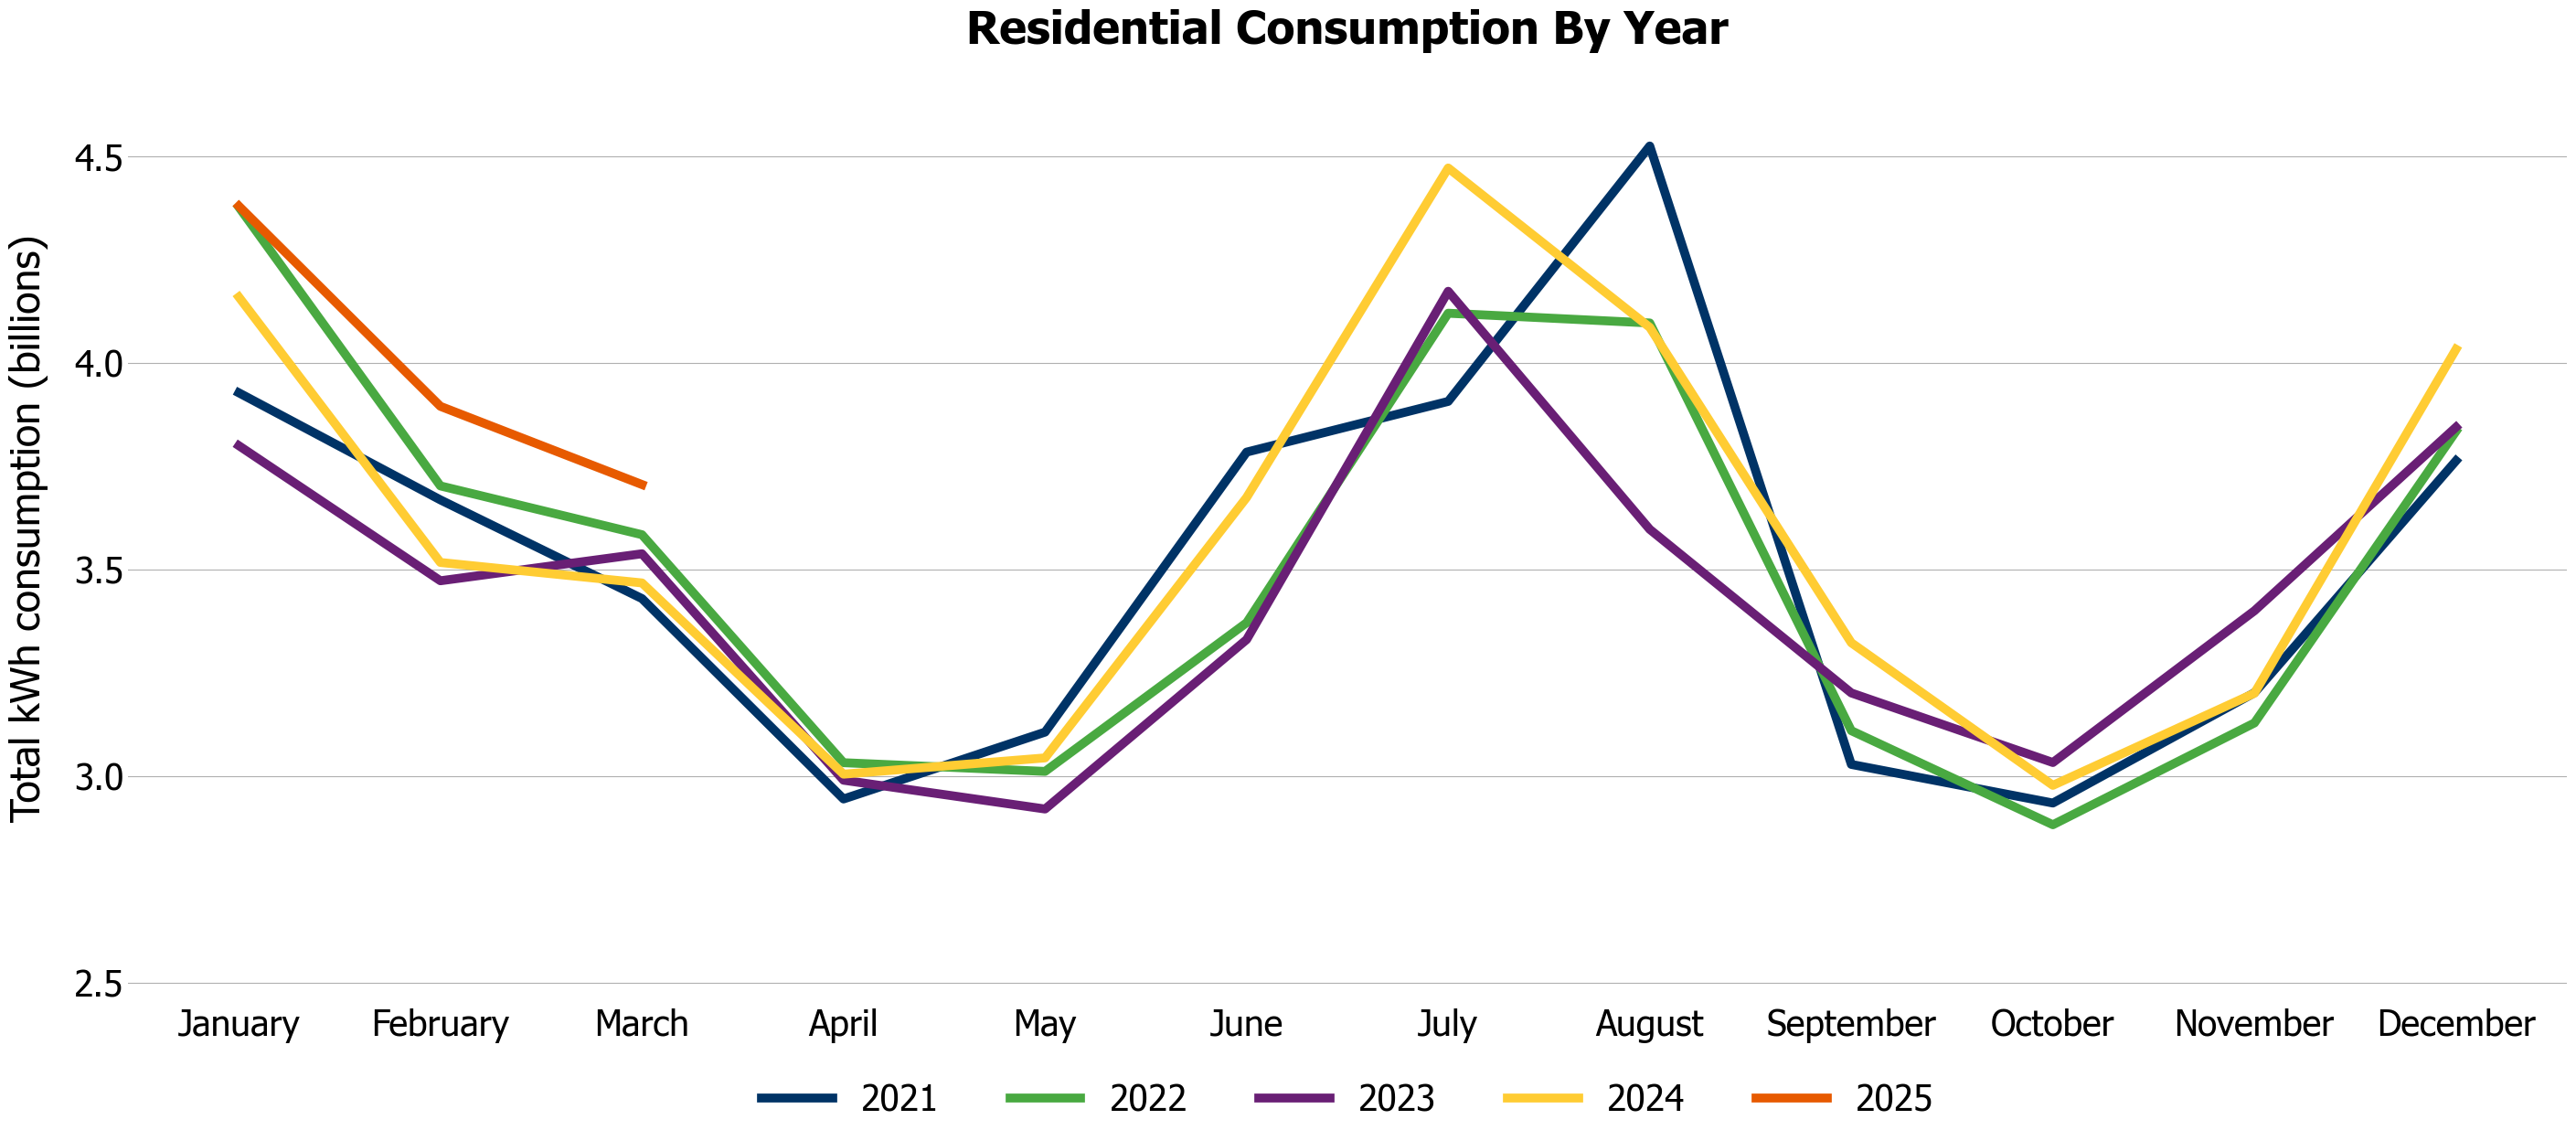
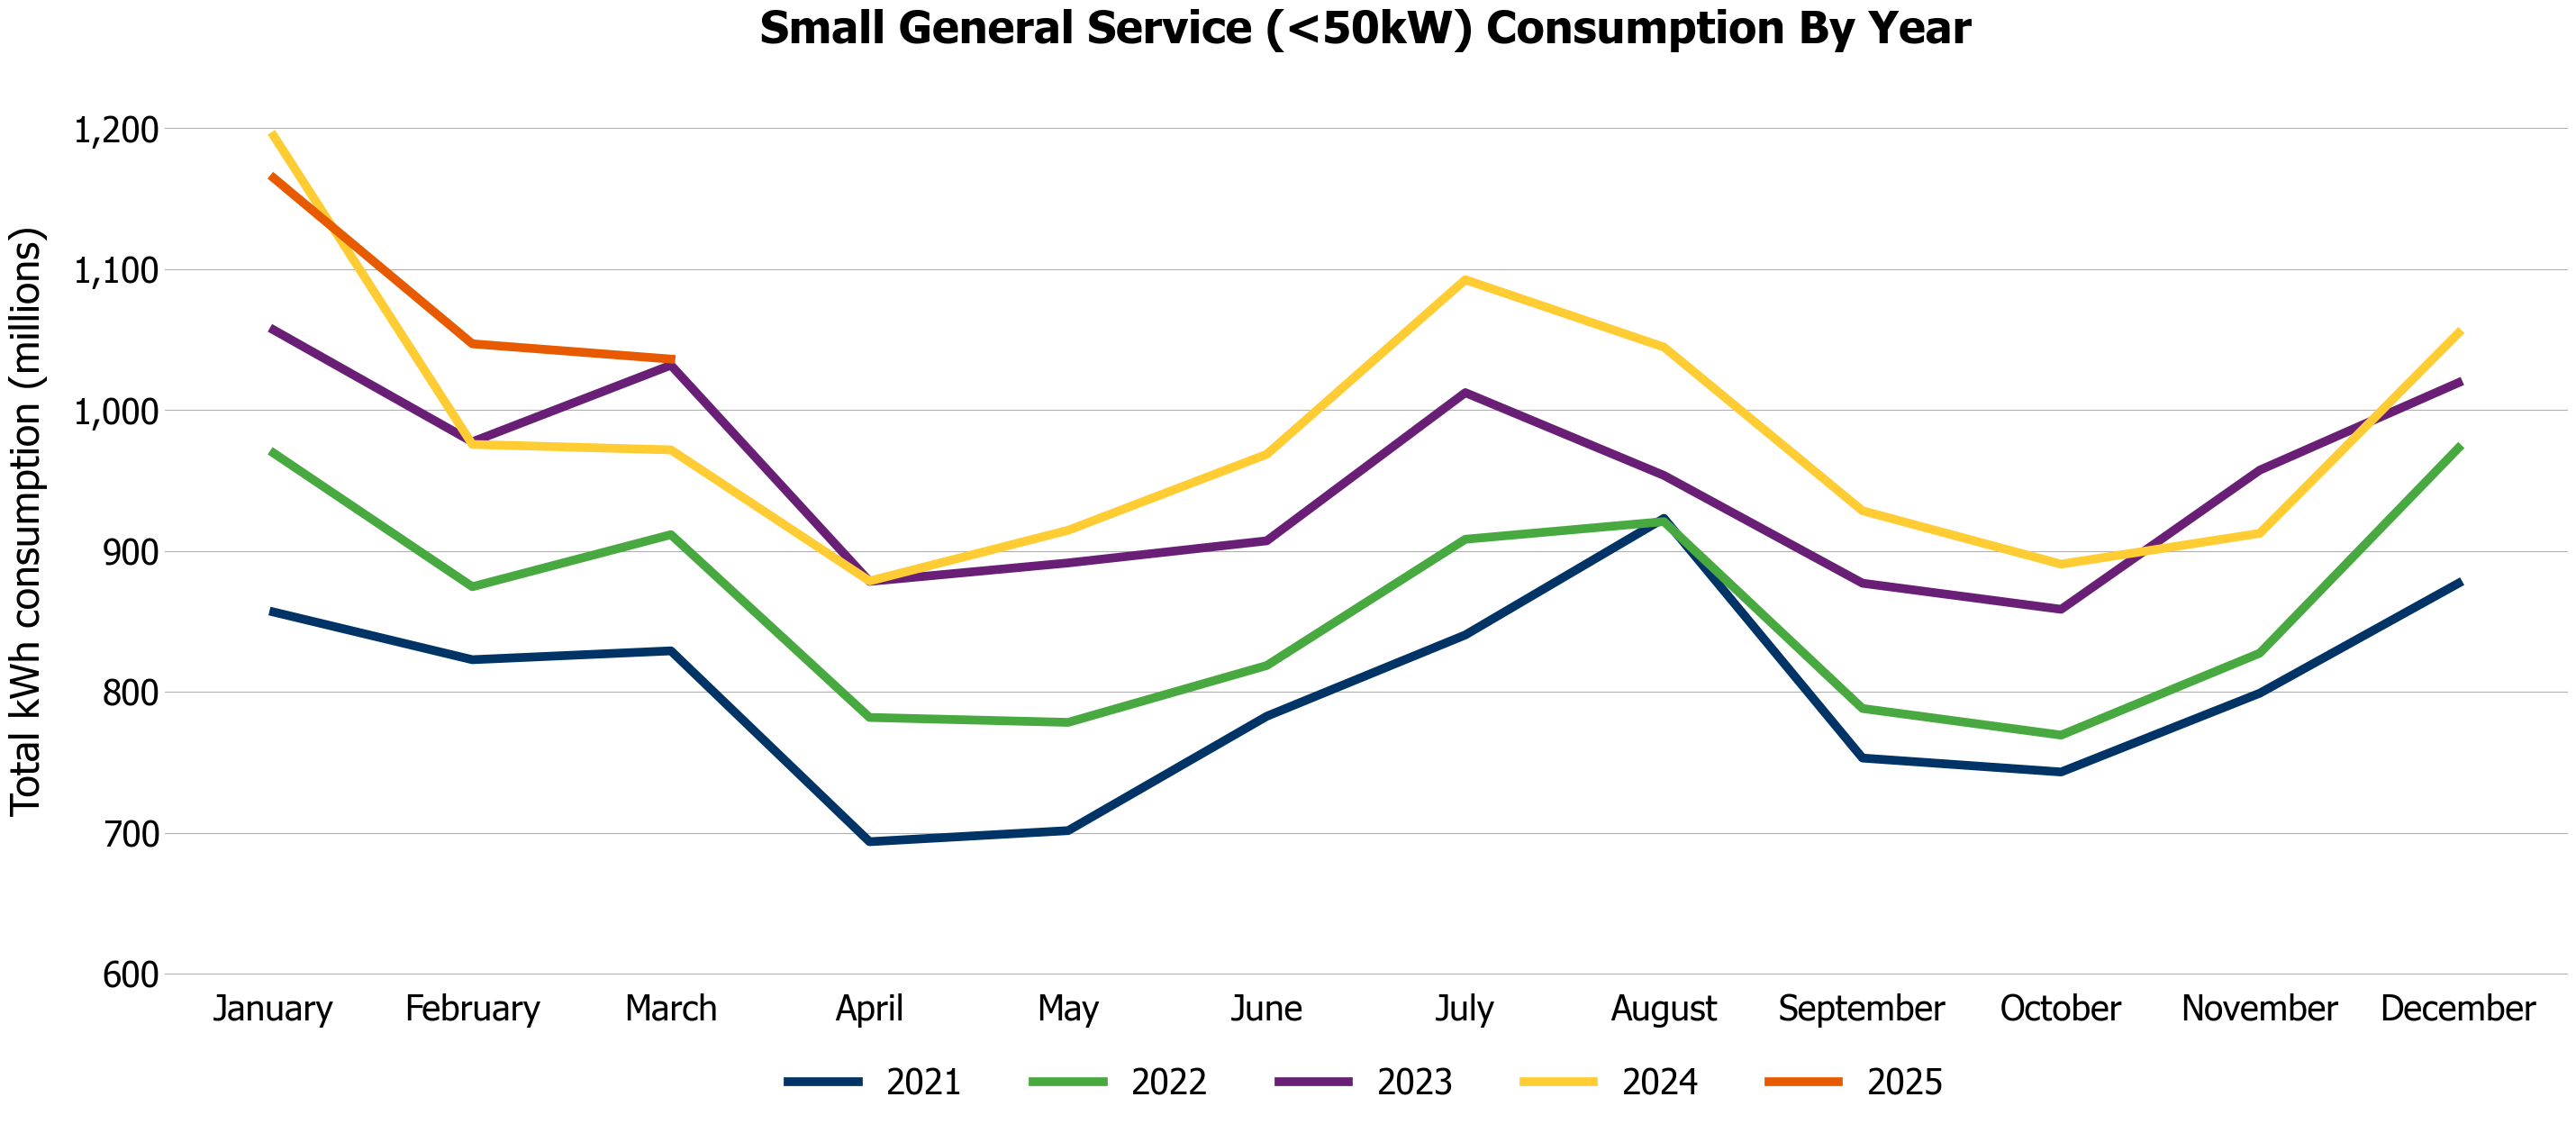
Some of this data was used to show the earlier impacts of COVID-19 on Ontario's electricity system as well as average home consumption patterns.

| Year | Meter Count |
|---|---|
| 2018 | 4,591,765 |
| 2019 | 4,664,946 |
| 2020 | 4,701,460 |
| 2021 | 4,732,143 |
| 2022 | 4,757,056 |
| 2023 | 4,769,622 |
| 2024 | 4,868,629 |
| 2025 | 4,937,154 |

| Year | Meter Count |
|---|---|
| 2018 | 366,166 |
| 2019 | 372,096 |
| 2020 | 372,778 |
| 2021 | 372,631 |
| 2022 | 412,491 |
| 2023 | 418,733 |
| 2024 | 423,693 |
| 2025 | 432,311 |
