2016
The Independent Electricity System Operator’s (IESO) release of 2016 electricity data shows that demand for electricity in the province last year remained flat as a result of ongoing conservation efforts and growth in embedded generation, while energy supplied to meet consumer needs was over 90 percent emissions-free. Looking ahead, the outlook for the reliability of Ontario’s electricity system remains positive for 2017.
Transmission-Connected Generation
Ontario’s bulk electricity grid has a diverse supply mix designed to meet the province’s needs, both today and in the future. Production by Ontario's baseload nuclear units remained high in 2016, comprising just over 60 percent of the transmission-connected electricity generated in Ontario. Combined with hydroelectric and growing wind and solar, 91 percent of Ontario’s energy was produced from emissions-free resources. Ontario’s natural gas output remains low at nine percent, but it continues to provide the electricity system with operational flexibility, a key component for maintaining reliability.
The table below provides a summary of Ontario's transmission-connected generator output, broken down by fuel type, for the past three years.
|
|
Nuclear |
Hydro |
Coal |
Gas/Oil |
Wind |
Biofuel |
Solar*/Other |
|---|---|---|---|---|---|---|---|
|
2016 |
91.7 TWh | 35.7 TWh | n/a | 12.7 TWh |
9.3 TWh | 0.49 TWh | 0.46 TWh |
|
2016 (% of total) |
61% | 24% | n/a | 9% | 6% | <1% | <1% |
|
2015 |
92.3 TWh |
36.3 TWh |
n/a |
15.4 TWh |
9.0 TWh |
0.45 TWh |
0.25 TWh |
|
2015 (% of total) |
60% |
24% |
n/a |
10% |
6% |
<1% |
<1% |
|
2014 |
94.9 TWh |
37.1 TWh |
0.1 TWh |
14.8 TWh |
6.8 TWh |
0.3 TWh |
0.0185 TWh |
|
2014 (% of total) |
62% |
24% |
<1% |
10% |
4% |
<1% |
<1% |
*Most solar facilities are connected to distribution systems, not the transmission system.
Due to rounding, percentages may not add to 100.
TWh = terawatt-hours
(Chart Updated January 26, 2017)
Embedded Generation
Ontario is also experiencing growth of smaller-scale distribution-connected, or embedded, generation. Embedded generators supply electricity to local distribution systems, which reduces demand on the transmission grid. At the end of 2016, there were more than 3,100 megawatts (MW) of embedded generation in commercial operation within local distribution systems. This capacity will continue to grow in 2017.
Demand
Annual demand on the province’s bulk power grid has declined over the last 10 years as a result of conservation, distributed energy resources and changes in the economy. Total energy withdrawn from the high-voltage transmission system by Ontario loads in 2016 reached 137.0 terawatt-hours (TWh), unchanged from 137.0 TWh in 2015.
Peak demand for electricity in 2016 reached 23,213 MW on September 7, 2016, the highest since July 17, 2013, when provincial electricity demand reached 24,927 MW.
Another contributor to the downward pressure on peak demand is the Industrial Conservation Initiative (ICI). Preliminary estimates indicate that the ICI reduced the summer 2016 peak by about 1,300 MW. Effective January 1, 2017, ICI eligibility was expanded by lowering the threshold for participation to 1 MW and expanding eligibility to all sectors.
Price
The weighted wholesale price of electricity – the Hourly Ontario Energy Price (HOEP) – for 2016 was 1.66 cents/kilowatt-hour (kWh). The estimated 2016 Global Adjustment (GA) Class B rate as at December 31, 2016, was 9.66 cents/kWh. The total cost of power for Class B consumers, representing the combined effect of the HOEP and the GA, was 11.32 cents/kWh.
Imports/Exports
Ontario is connected to a large network of transmission systems across North America, which supports system reliability and economic efficiency. Imports compete against domestic supply to provide electricity at the best possible price and to support the province's needs during periods of high demand. Ontario also exports electricity when economic and to help maintain system reliability.
While Ontario continues to be a net exporter, 2016 saw a small reduction in export volumes from that of 2015. The table below provides a summary of Ontario's electricity imports and exports for 2015 and 2016.
| 2016 Total Exports | 21,858.1 GWh |
| 2016 Total Imports | 7,994.8 GWh |
| 2015 Total Exports | 22,618.0 GWh |
| 2015 Total Imports | 5,763.5 GWh |
| Change from Previous Year (Exports) | - 759.9 GWh (- 3.36%) |
| Change from Previous Year (Imports) | 2,231.3 GWh (+ 38.7%) |
Note: 2016 was a leap year, therefore the above numbers for 2016 are based on 366 days.
GWh = gigawatt-hours
Conservation
Conservation is a cost-effective and reliable resource that leverages investments that have already been made in existing assets and helps avoid investments in more expensive electricity infrastructure. Preliminary results for 2016 indicate more than 392,000 megawatt-hours (MWh) of net energy savings attributable to programs delivered by local distribution companies and the IESO, helping Ontario remain on track to meet its 7 TWh Conservation First Framework target and its 1.7 TWh target from the Industrial Accelerator Program by 2020.
See more conservation results.
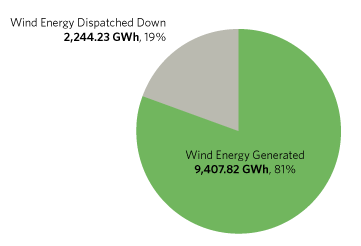
Wind Dispatch Overview
With the implementation of the dispatch of renewable generation in fall 2013, wind generation facilities in Ontario help support ramping and balancing on the system. In particular, the wind dispatch helps avoid nuclear shutdowns during periods of surplus baseload generation (SBG).
The wind dispatch is just one tool used by the IESO to provide operational flexibility. The integration of hourly centralized forecast into the IESO scheduling tools as well as enhanced visibility of renewable output have also been instrumental in managing a system with increasing levels of renewable generation with greater efficiency.
In 2016, the total amount of wind energy that was dispatched down was 2,244.23 GWh, representing 19 per cent of the total amount of wind energy produced in the province. A greater proportion of wind energy was dispatched down in 2016 compared to 2015, due to a Market Rule change on February 18, 2016 for the floor price of renewables. Renewables are a flexible, 5-minute dispatchable resource, and therefore wind is dispatched down before manoeuvring nuclear during surplus baseload conditions. See Floor Price Review for a history of the stakeholder initiative.
Wind Dispatch - Actual Energy (GWh)
*Note that these values include grid-connected wind generation only.
Nuclear Manoeuvres and Shutdowns Overview
Nuclear manoeuvring capability offered by Bruce Power supports system reliability by reducing output by approximately 300 megawatts (MW) for each operating unit. This capability assists in continually balancing supply and demand and also maintains the reliability of the grid during periods of surplus baseload generation (SBG). The exact amount of available reductions varies from time-to-time based on prevailing technical and regulatory restrictions.
Nuclear Manoeuvres
There were 393 nuclear reductions due to SBG in 2016, representing a total of 665.2 GWh.
Nuclear Shutdowns
In 2016, there were 2 nuclear shutdowns due to SBG conditions.
Nuclear Manoeuvres and Shutdowns - Actual Energy (GWh)
*Note that these values include all nuclear reductions for SBG, not reductions made for other reasons (such as planned/forced outages).
![]()
Other IESO Initiatives
The year 2016 was marked by a number of other initiatives at the IESO, including:
- The release of the Ontario Planning Outlook, which provides planning context for the public, policy makers and industry stakeholders through a 10-year review and a 20-year outlook for Ontario’s electricity system
- the second market-driven demand response auction, which resulted in both increased participation, including from residential customers, and prices for demand response capacity that are 12 to 17 percent lower than 2015
- the announcement of 16 successful proponents under the Large Renewable Procurement process, as well as 936 supply contracts under the FIT 4 Program
- the launch of the Energy Partnerships Program, designed to support Indigenous communities, co-operatives, municipalities and public sector entities to participate in Ontario’s clean energy economy
- the release of the Achievable Potential Study to help inform the Conservation First Framework mid-term review in 2017 and electricity efficiency planning and programs in Ontario.