Transmission-Connected Generation
Transmission-connected generation refers to facilities that are connected to the high-voltage IESO-Controlled Grid, which include all lines over 50 kilovolts (kV), such as 115 kV, 230 kV, and 500 kV transmission lines. The low-voltage grid is operated by local distribution companies.
Real-time Supply Output
The current hourly output by fuel type reported on the homepage and the Power Data page represents the production values of transmission-connected generation. This real-time data comes from the hourly Generator Output and Capability report, that provides output levels from generators, registered as market participants, with capacities of 20 megawatts (MW) or greater.
Distribution-connected generation (also known as embedded generation) is not reported through the Generator Output and Capability report. More information can be found in the distribution-connected generation section.
Current Installed Capacity
Ontario’s supply mix has significantly changed over the last decade—wind, solar, bioenergy, waterpower, refurbished nuclear and natural gas-fired resources have replaced Ontario’s coal fleet. The current Reliability Outlook reports that Ontario's installed (transmission-connected) generation capacity totals 37,760 MW. The amount of generation actually available from day-to-day is dependent on current conditions, including facility outages (planned maintenance or unplanned).


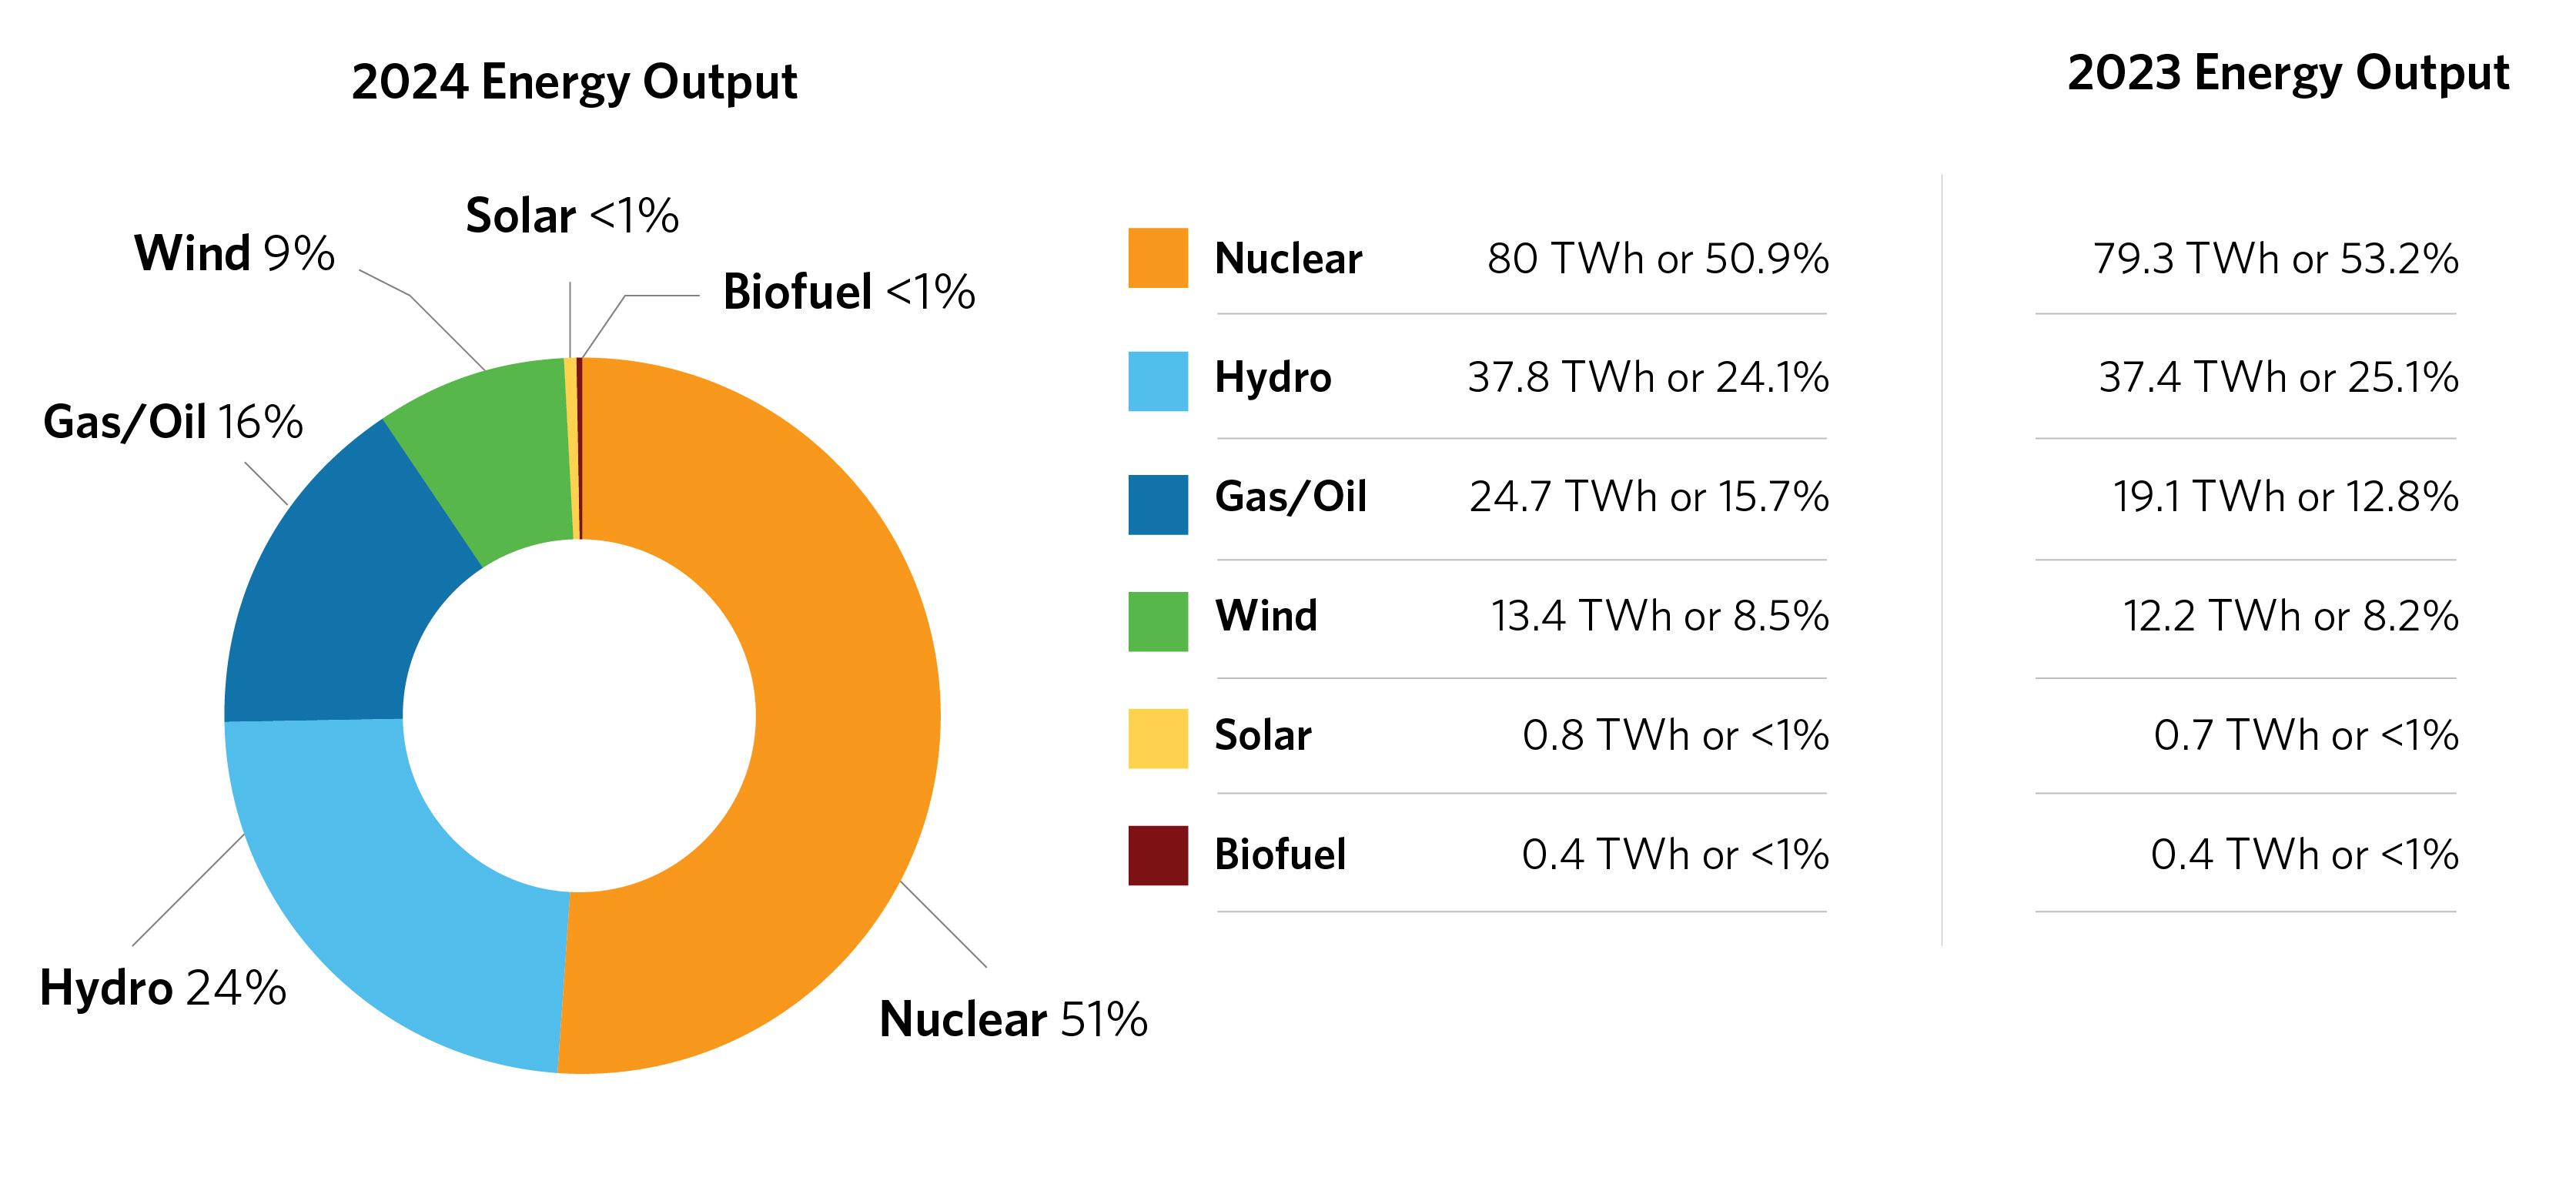
| Year | Nuclear | Hydro | Gas/Oil | Wind | Biofuel | Solar |
|---|---|---|---|---|---|---|
|
2024 |
80 TWh 50.9% |
37.8 TWh 24.1% |
24.7 TWh 15.7% |
13.4 TWh 8.5% |
0.4 TWh <1% |
0.8 TWh <1% |
|
2023 |
79.3 TWh 53.2% |
37.4 TWh 25.1% |
19.1 TWh 12.8% |
12.2 TWh 8.2% |
0.4 TWh <1% |
0.7 TWh <1% |
|
2022 |
78.8 TWh 53.7% |
38.0 TWh 25.9% |
15.2 TWh 10.4% |
13.8 TWh 9.4% |
0.3 TWh <1% |
0.75 TWh <1% |
|
2021 |
83.0 TWh 58.2% |
34.2 TWh 24% |
12.2 TWh 8.6% |
12 TWh 8.4% |
0.4 TWh <1% |
0.75 TWh <1% |
|
2020 |
87.8 TWh 60% |
36.9 TWh 25% |
9.7 TWh 7% |
11.8 TWh 8% |
0.4 TWh <1% |
0.8 TWh <1% |
|
2019 |
90.4 TWh 61% |
36.4 TWh 25% |
9.5 TWh 6% |
11.0 TWh 7% |
0.4 TWh <1% |
0.7 TWh <1% |
| 2018 |
90.1 TWh 61% |
36.2 TWh 25% |
9.6 TWh 6% |
10.7 TWh 7% |
0.4 TWh <1% |
0.6 TWh <1% |
| 2017 |
90.6 TWh 63% |
37.7 TWh 26% |
5.9 TWh 4% |
9.2 TWh 6% |
0.4 TWh <1% |
0.5 TWh <1% |
| 2016 |
91.7 TWh 61% |
35.7 TWh 24% |
12.7 TWh 9% |
9.3 TWh 6% |
0.49 TWh <1% |
0.46 TWh <1% |
